Roofing · Territory X-Ray
The roofs that haven't been replaced yet, ranked.
Here's what you get: the neighborhoods in the towns you roof, ranked by how many homes are likely due for a new roof. Then a mail-ready list of those exact homes, with the ones that just pulled a roofing permit already removed. Real addresses, so you start where the roofs actually are.
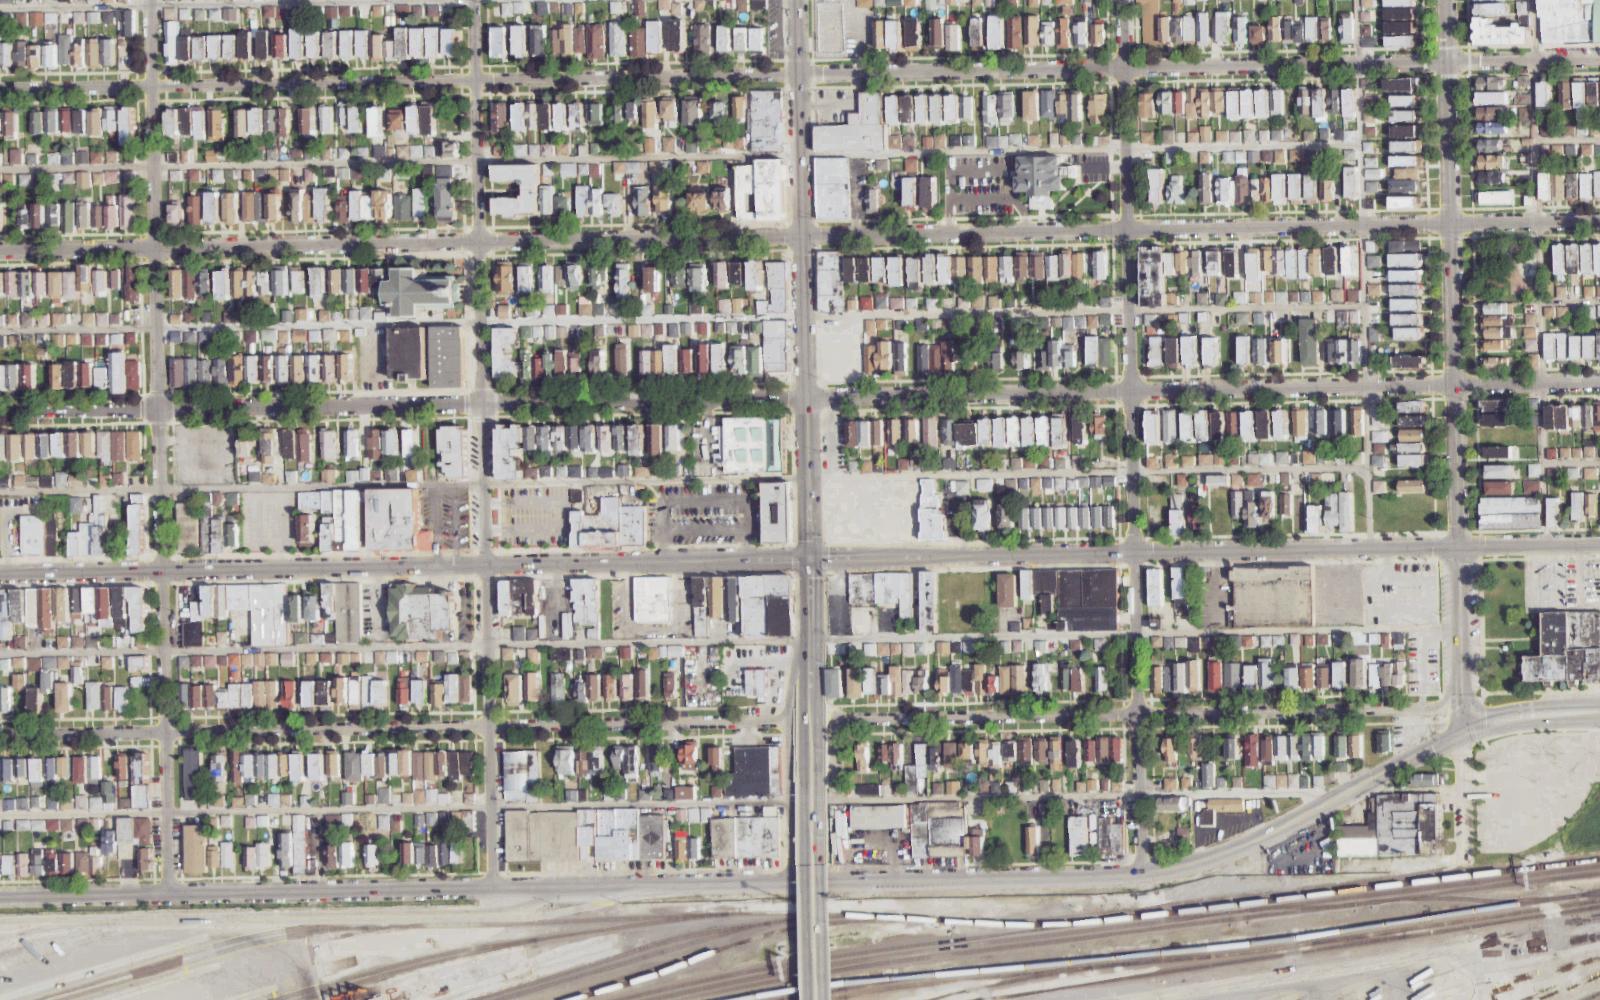 Territory X-Ray · Cicero, IL
The roofs in your territory, from above.Real aerial · sample
Territory X-Ray · Cicero, IL
The roofs in your territory, from above.Real aerial · sample
The moat
The signals nobody else has wired together.
Most roofing lead lists are 5 ZIPs and a homeowner age band. Ours starts with the roof.
Free LiDAR-measured roof size
We measure roof squares from public LiDAR, which is the real ticket-driver. Calibrated 1.54× against ground-truth roof reports, pitch-constrained to reject walls and tree edges. Internal-only until a county-level calibration pass; honest about every limit.
Re-roofs already done get suppressed
Cook County roof permits, indexed by PIN. If a home has a roof permit on the county record, which reaches back to 2018, it falls off the mail list automatically. About 7.4% of homes, removed from the spend.
NOAA storm-cohort overlay
We overlay the NOAA Storm Prediction Center hail database (11,000+ Illinois reports) to flag the townships that took post-storm waves and the years they happened. Used for timing, not damage claims.
The X-Ray
Your neighborhoods, ranked.
Every neighborhood in your service area gets a score. Behind each score: roof age, measured size, material, owner-occupancy, storm cohort, and the share of homes already re-roofed. Every rank carries the reasons it earned.
- Cluster-level rank with score 0–100
- Reason codes for every neighborhood (why it ranked high or low)
- Owner-occupant % and absentee split
- Reroofed % (the suppression overlay)
- Storm-cohort year if one applies
The Campaign Map
A deployable target list, with the reason next to every home.
When you pick a neighborhood, the campaign map ships as a deployable list: clean addresses, owner-occupant flagged, recently-permitted homes already removed. Every row carries its own reason code so you can write the door knock around the truth.
- 100% addresses, owner-occupant vs investor flagged
- Per-home reason codes (e.g. "110-yr home · 1.04× neighborhood roof size · no recent permit")
- Suppression: recently re-roofed, vacant, masonry-only frames
- Tracking IDs for QR / unique URLs / call attribution
- Projected ROI band, with break-even job count and base multiplier
What goes in
Every signal that drives the score.
All public-record and all sourced, with nothing scraped or implied.
LiDAR squares per home
Plane-fit roof area from public LiDAR, calibrated against ground-truth roof reports. Pitch-constrained to reject walls and trees.
Year built and reroof history
Year built from CAMA, plus the county roof-permit record. Between them you get the homes whose original or last roof is past warranty.
Asphalt, tile, metal
Material from CAMA. Mainstream-asphalt neighborhoods get prioritized for first-campaign maps.
NOAA SPC storm history
Townships that took post-storm permit waves. That is timing context, not a damage claim.
Owner-occupant vs investor
ZIP + house-number match between property and mailing address. Owner-occupants get the lead lane; absentees get the investor lane.
The re-roof check
Indexed Cook roof permits exclude recently-re-roofed homes from the mail list. Roughly 7.4% of parcels, saved.
ROI math, honest
How a Roofing Territory X-Ray pays for itself.
Worked off a 1,500-home first-campaign cell at typical roofing economics. Numbers are illustrative; your costs, response rate, and close rate slot in here.
We do not promise a job count. We project an ROI band, and the X-Ray investment is paid back at well under one sold job in most service areas.
Run gutters or siding too?
Cross-trade rank: one neighborhood, three offers.
The Cross-Trade Briefing names the single best neighborhood where roofing, gutters, and siding are all hot at once, and it tells you where to send each crew separately too. One mail drop, layered offer, shared truck-roll.
Guardrails
What we say. What we don't.
Show roof age, estimated size, material, and storm-window timing, all from the public record.
Suppress homes that re-roofed recently so you don't waste a mailer on a 2-year-old roof.
Project an ROI band and the break-even job count for your service area.
Claim a specific roof is damaged. Measurements are estimates for contractor review.
Sell raw homeowner contact lists. The Campaign Map ships only to the contractor running the campaign.
Promise a job count or imply government affiliation.
FAQ
The questions roofers ask first.
Will I get a list of homeowners' names and phone numbers?
No. The Campaign Map is a deployable target file (addresses, owner-occupant flags, suppression flags) designed for direct mail, canvass, or door knocking. We do not sell or distribute homeowner contact data.
How do you know a roof's size?
We measure it from public LiDAR with a plane-fitting algorithm, then calibrate against ground-truth roof reports (1.54× CAMA calibration verified). The fitter is pitch-constrained, so it rejects walls and tree edges that look like roof from above. Measured squares are estimates for contractor review until a county-wide calibration pass is published.
What's the "permit suppression," and is it accurate?
It's the Cook County roof-permit index, indexed by PIN. The index holds 94,645 permits; 82,591 match a residential parcel, 7.4% of the county, nearly all filed 2018 or later. Those parcels are automatically excluded from the Campaign Map so you don't mail a home whose roof you can already see is new.
Can you do storm-damage targeting?
We can overlay the NOAA Storm Prediction Center hail history and tell you which townships took post-storm permit waves and when. We don't claim a specific roof was damaged. That's still a contractor's call after the inspection.
What if I work outside Cook County?
Our deepest data is Cook (1.1M parcels, full permit index, calibrated roof measurement). Outside Cook we work from the parcel + GIS + ownership layer that the county publishes, plus the NOAA hail layer. The X-Ray still runs, but the moat narrows.
What does a Territory X-Ray cost?
$1,500–$2,500 for the service-area scan, ranked neighborhoods, first campaign map, offer angle, and a review call. The Campaign Map deployment and Revenue Command tracking are quoted separately. No software contract.
Your cockpit
Sign in to your live Roofing X-Ray.
When the X-Ray finishes, your cockpit goes live. Ranked neighborhoods, a real territory map, per-PIN reason codes, and the deployable campaign list, all in your browser. We hand you the keys; nothing leaves your account.
- Live neighborhood ranking with FIT score 0–100
- Territory map with priority cluster pulses
- Per-area roof-size, vintage, owner-occ, hail-cohort signals
- Deployable address list, yours and route-ordered
- Updates on every monthly run
Run the X-Ray on your service area.
Tell us your county and the towns you work. We'll come back with the ranked neighborhoods, a sample reason code for each, and the first campaign map.
Request a Roofing X-Ray